Case Study: Drag-n-Drop Data Pipeline Builder
Overview
The company needed a more intuitive way for non-technical users to create, modify, and monitor data pipelines used across our AI products. Existing workflows required deep engineering support and were error-prone. The goal was to build a visual drag-and-drop pipeline builder that democratized complex data transformations and accelerated development.
I led the end-to-end UX effort: research, IA, interaction design, visual system, prototyping, and engineering alignment to transform an engineering-heavy process into a low-code, visual workspace.
Role
Lead UX Designer
Timeline
12 Weeks
Product Type
Enterprise SaaS
Data Workflow Builder
Low-Code/No-Code Tooling
Team
1 UX Designer (me)
1 Product Manager
1 Lead Engineer
4 Backend Engineers
Problem & Context
AI-driven apps rely on data pipelines composed of steps like ingestion, transformation, validation, and export.
At the time:
Users could not build or modify pipelines without engineering
The process involved JSON scripts, CLI tools, and outdated internal UIs
Misconfigurations were common
Pipelines were hard to debug or visualize
Primary Users:
Data analysts (semi-technical, needed clarity + control)
Data scientists (wanted faster iteration cycles)
Business-facing AI product teams (needed visibility without engineering support)
Constraints:
Highly technical backend architecture
Dozens of pipeline “node types” with different parameters
Strict validation rules
Need for real-time feedback
Must integrate with an existing design system
Opportunity:
Build an intuitive, scalable, visual interface that:
lowers the skill barrier
speeds up app deployment
reduces engineering bottlenecks
increases pipeline reliability
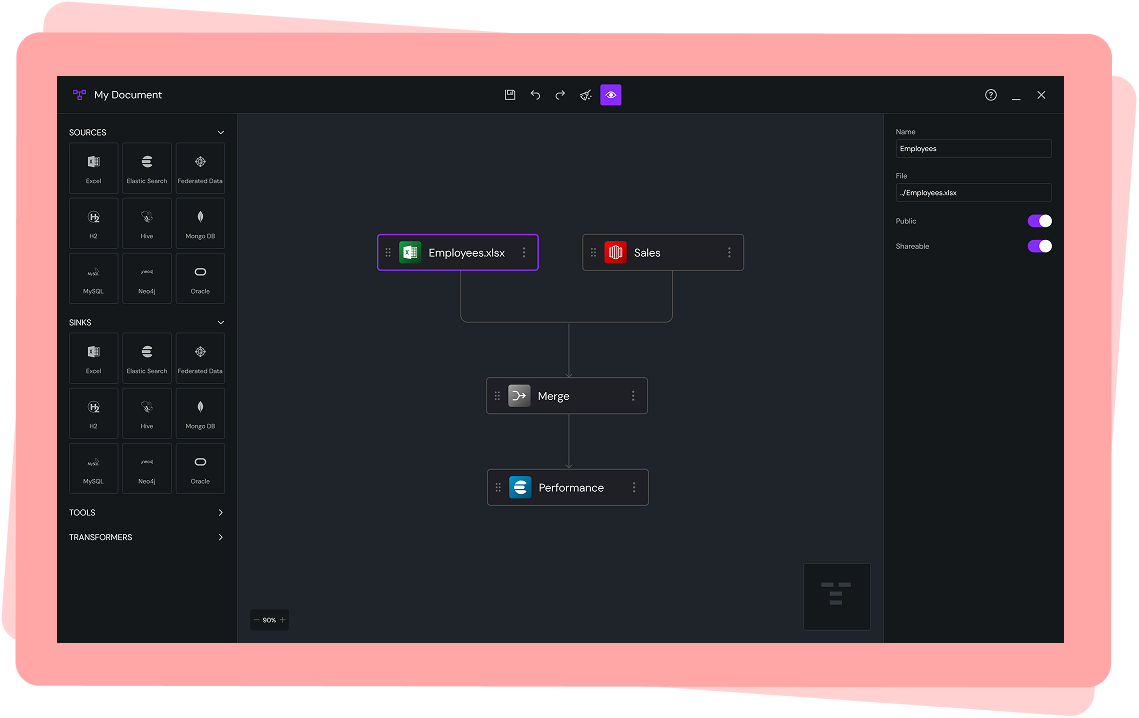
Drop a data element from the left panel onto the canvas, connect it like a flowchart, and edit properties on the right. Drag-n-drop, low-code/no-code makes data pipeline building easy enough for even novice users to understand.
Research & Insights
Methods
12 stakeholder interviews
Shadowing data science workflows
Audit of existing pipeline-building tools
Key Insights from Stakeholder Interviews
Users didn’t understand pipeline errors, no clear visualization or debugging tools.
Most pipelines followed similar patterns, meaning reusable templates would save time.
Technical users wanted depth, while non-technical users needed guardrails.
People didn’t want a toy UI—they wanted genuine power in a visual format.
Parameters were the highest friction area, due to inconsistent naming and validation.
These insights shaped two core principles:
Make the system visual first
Make complex configuration feel simple
Defining the Experience
I created a product foundation around four pillars:
1. Visual First: A canvas-based drag-and-drop workspace with zoom/pan, node linking, and real-time validation.
2. Explainable Pipelines
Every node surfaces clear inline hints:
Required vs optional parameters
Warnings before errors
Intelligent defaults
Contextual help
3. Guardrails + Flexibility
Common tasks highlighted for beginners; affordance for experts to override settings.
4. System Thinking
Patterns, spacing, color semantics, and iconography all derived from the design system, ensuring extensibility as new nodes/types emerge.
Ideation & Concept Development
Early Concepts Explored
Sidebar nodes > drag to canvas
Right-pane property sheets for configuration
Block-based “Lego” approach with auto-snap
Top-down flowchart vs left-right pipeline flow
Template gallery for rapid creation
Real-time state visualization
Mini-map for large pipelines
Zoomable infinite canvas
Key Decision
Maintain a unified interaction model across all node types even though the backend logic varied dramatically. This reduced cognitive load and improved learnability.
User Flow - Starting the App
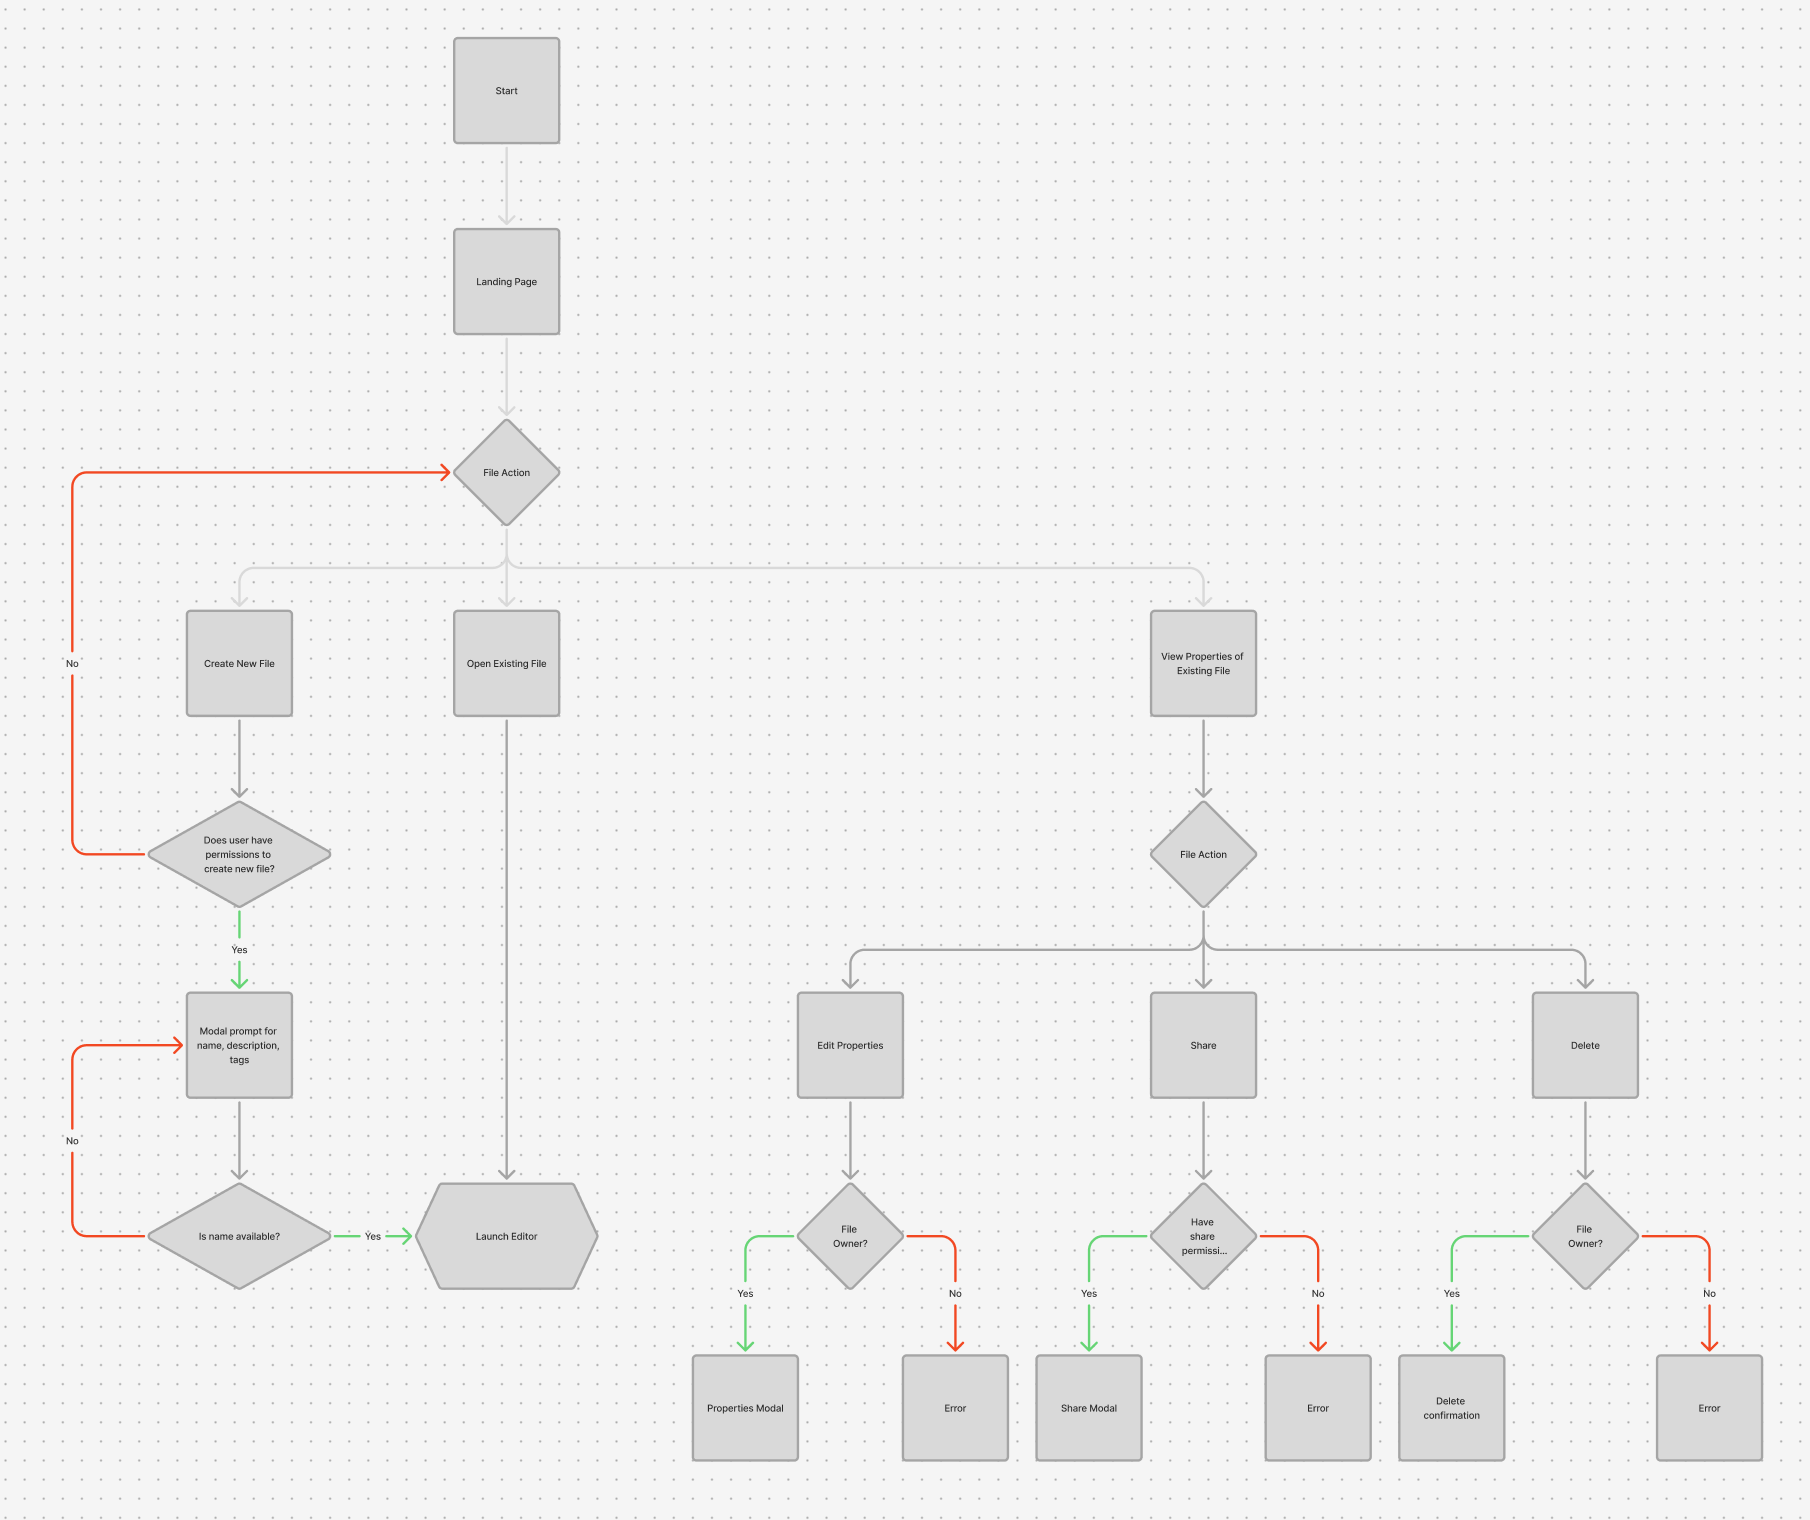
This user flow maps the primary entry paths into the product, from initial launch through file creation, management, and editing. It demonstrates how the system adapts to user intent and permissions, balancing fast access to core workflows with guardrails around high-impact actions like sharing and deletion.
Key Design Principles Demonstrated in This Flow
1. Early Intent Clarification
The initial “File Action” decision point allows users to immediately express intent:
Create something new
Continue existing work
Inspect or manage an asset
This avoids unnecessary navigation and keeps the user mentally oriented.
2. Permission-Aware Design
Throughout the flow, actions like:
Creating files
Editing properties
Sharing
Deleting
are gated behind permission and ownership checks.
Instead of surfacing actions the user can’t complete, the system validates intent at the moment of action and provides clear feedback when an action isn’t allowed.
This prevents:
Silent failures
Confusing disabled states
Accidental destructive behavior
3. Progressive Commitment
Low-risk actions (opening a file, viewing properties) move quickly.
High-impact actions (sharing, deleting, publishing changes) introduce:
Explicit confirmation steps
Modals with contextual information
Clear success or error outcomes
This reflects a deliberate tradeoff between speed and responsibility.
4. Non-Blocking Error Handling
When users encounter an error (e.g., insufficient permissions), the flow:
Clearly communicates why the action failed
Prevents data loss
Allows users to safely recover or choose another path
Errors are treated as system feedback, not dead ends.
5. Fast Path to Core Work
Once validation passes:
Creating or opening a file leads directly to the editor
Users aren’t forced through unnecessary setup steps
The product quickly transitions from “management mode” to “creation mode”
Impact
Quantitative
60%
Reduction in pipeline creation time
Qualitative
“Finally, I can see what the pipeline is doing.”
-Developer
45%
Decrease in pipeline configuration errors
“I don’t need an engineer every time anymore.”
-Developer
35%
Reduction in engineering support requests
“Much easier, more powerful than before.”
-Developer
Strategic Impact
This project enabled:
A shift from engineering-led pipeline creation to true self-service data workflows
Faster experimentation and iteration across AI products
Reduced engineering bottlenecks in model development and deployment
Broader adoption of the platform by semi-technical and business-facing teams
A scalable foundation for future low-code and automation initiatives
It fundamentally changed how the organization builds, understands, and operates its data infrastructure.
Final Design
A. The Canvas
Snap-to-grid for alignment
Panning + zooming interactions modeled after Figma
Smooth animations for node linking
Real-time visual validation (red = error, amber = warnings)
B. Node Palette
Grouped by function:
Data Sources
Data Sinks
Transformation
Tools (forks, mergers)
Search + tags for fast filtering.
C. Node Detail Panel
The right-side panel updates based on selected node:
Collapsible sections
Inline documentation
Smart defaults
Dependency-aware parameters
D. Pipeline Templates
Pre-built flows for:
CSV ingestion pipelines
Model-training pipelines
Daily data refresh jobs
These reduced pipeline creation time by ~60%.
E. Versioning & Error Handling
Pipeline “timeline” view
Step-by-step diff comparisons
Highlighting nodes that changed
F. Design System Integration
New icons for each pipeline node
Semantic colors (success, processing, failed)
Fluid spacing + consistent grid
Reusable components published to design system library