Case Study: Drag-n-Drop Data Pipeline Builder
Overview
The company needed a more intuitive way for non-technical users to create, modify, and monitor data pipelines used across our AI products. Existing workflows required deep engineering support and were error-prone. The goal was to build a visual drag-and-drop pipeline builder that democratized complex data transformations and accelerated development.
I led the end-to-end UX effort: research, IA, interaction design, visual system, prototyping, and engineering alignment to transform an engineering-heavy process into a low-code, visual workspace.
Role
Lead UX Designer & Product Strategist (Individual Contributor + Design Leadership)
Timeline
12 weeks
Product Type
Enterprise SaaS • Data Workflow Builder • Low-Code/No-Code Tooling
Team
1 UX Designer (me), 1 PM, 1 Lead Engineer, 4 Backend Engineers
Problem & Context
AI models rely on data pipelines composed of steps like ingestion, transformation, validation, and export.
At the time:
Users could not build or modify pipelines without engineering
The process involved JSON scripts, CLI tools, and outdated internal UIs
Misconfigurations were common
Pipelines were hard to debug or visualize
Primary Users:
Data analysts (semi-technical, needed clarity + control)
Data scientists (wanted faster iteration cycles)
Business-facing AI product teams (needed visibility without engineering support)
Constraints:
Highly technical backend architecture
Dozens of pipeline “node types” with different parameters
Strict validation rules
Need for real-time feedback
Must integrate with an existing design system
Opportunity:
Build an intuitive, scalable, visual interface that:
lowers the skill barrier
speeds up app deployment
reduces engineering bottlenecks
increases pipeline reliability
Research & Insights
Methods
12 stakeholder interviews
Shadowing data science workflows
Audit of existing pipeline-building tools
Key Insights from Stakeholder Interviews
Users didn’t understand pipeline errors, no clear visualization or debugging tools.
Most pipelines followed similar patterns, meaning reusable templates would save time.
Technical users wanted depth, while non-technical users needed guardrails.
People didn’t want a toy UI—they wanted genuine power in a visual format.
Parameters were the highest friction area, due to inconsistent naming and validation.
These insights shaped two core principles:
Make the system visual first
Make complex configuration feel simple
Defining the Experience
I created a product foundation around four pillars:
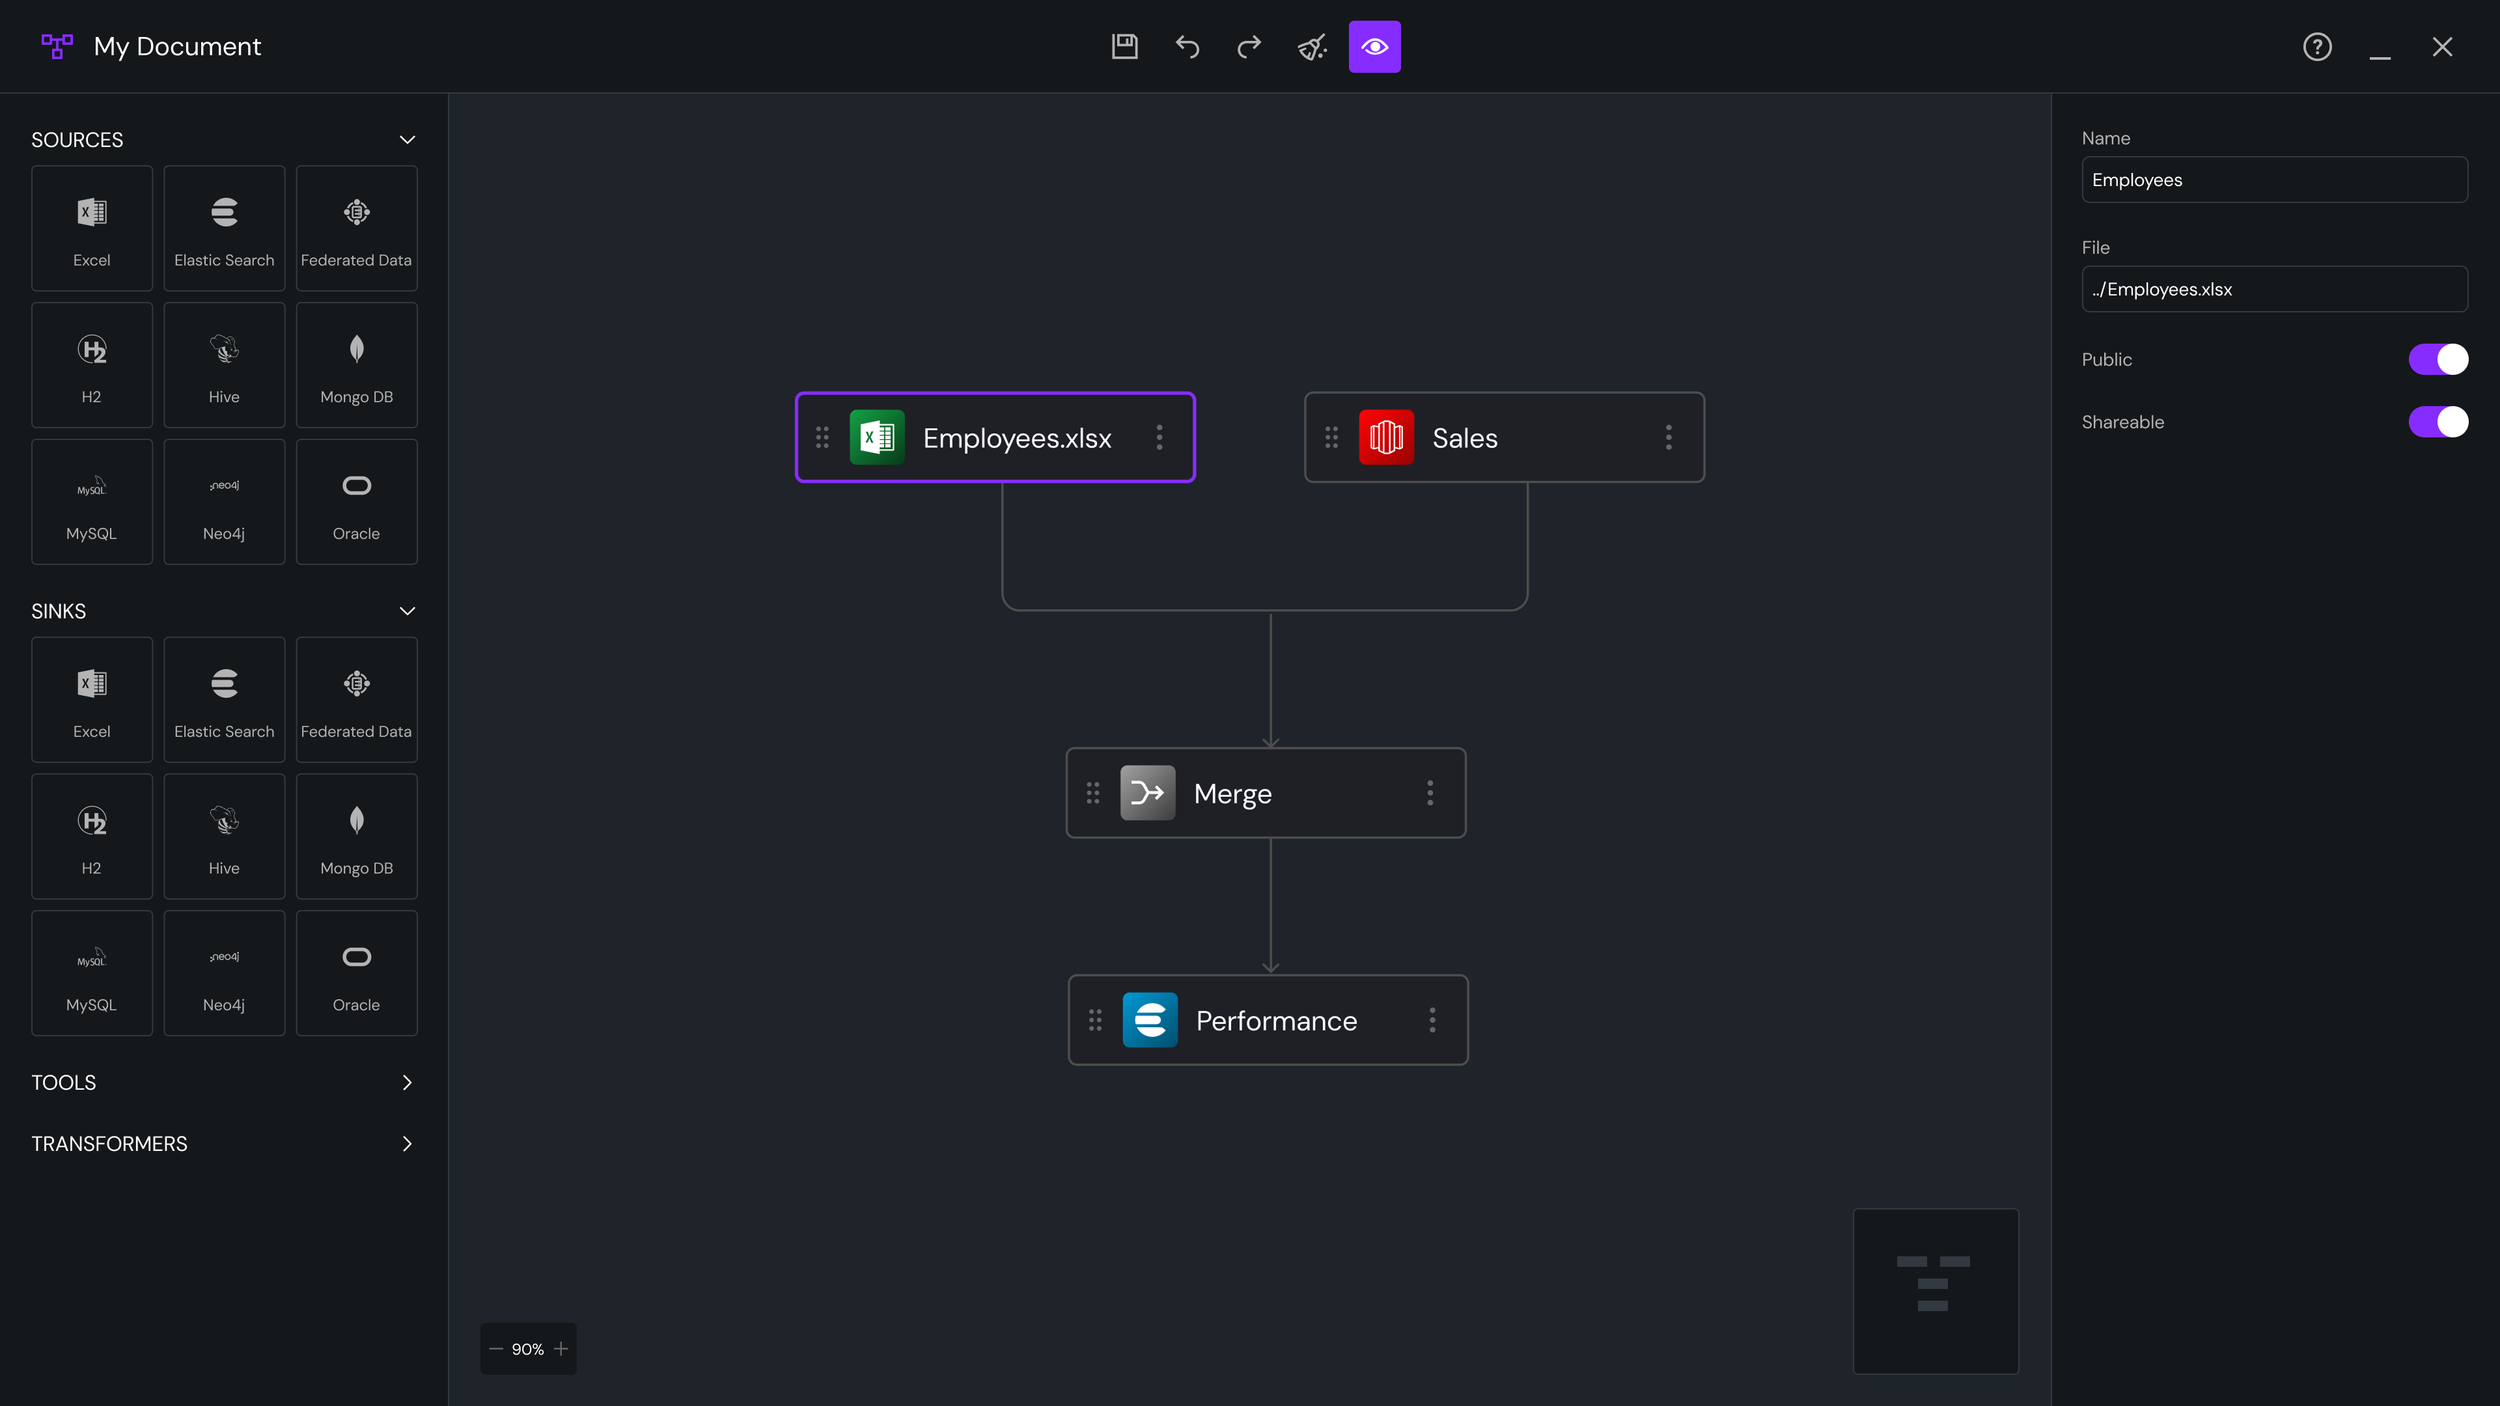
1. Visual First: A canvas-based drag-and-drop workspace with zoom/pan, node linking, and real-time validation.
2. Explainable Pipelines
Every node surfaces clear inline hints:
Required vs optional parameters
Warnings before errors
Intelligent defaults
Contextual help
3. Guardrails + Flexibility
Common tasks highlighted for beginners; affordance for experts to override settings.
4. System Thinking
Patterns, spacing, color semantics, and iconography all derived from the design system, ensuring extensibility as new nodes/types emerge.
Ideation & Concept Development
Early Concepts Explored
Sidebar nodes > drag to canvas
Right-pane property sheets for configuration
Block-based “Lego” approach with auto-snap
Top-down flowchart vs left-right pipeline flow
Template gallery for rapid creation
Real-time state visualization
Mini-map for large pipelines
Zoomable infinite canvas
Key Decision
Maintain a unified interaction model across all node types even though the backend logic varied dramatically. This reduced cognitive load and improved learnability.
Final Design
A. The Canvas
Snap-to-grid for alignment
Panning + zooming interactions modeled after Figma
Smooth animations for node linking
Real-time visual validation (red = error, amber = warnings)
B. Node Palette
Grouped by function:
Data Sources
Data Sinks
Transformation
Tools (forks, mergers)
Search + tags for fast filtering.
C. Node Detail Panel
The right-side panel updates based on selected node:
Collapsible sections
Inline documentation
Smart defaults
Dependency-aware parameters
D. Pipeline Templates
Pre-built flows for:
CSV ingestion pipelines
Model-training pipelines
Daily data refresh jobs
These reduced pipeline creation time by ~60%.
E. Versioning & Error Handling
Pipeline “timeline” view
Step-by-step diff comparisons
Highlighting nodes that changed
F. Design System Integration
New icons for each pipeline node
Semantic colors (success, processing, failed)
Fluid spacing + consistent grid
Reusable components published to design system library
What This Project Demonstrates About Me
I simplify highly technical workflows without losing power or flexibility.
I help shape product strategy through clear UX direction and informed decision-making.
I think in systems: patterns, scalability, and long-term maintainability guide my work.
I design experiences that balance low-code simplicity with expert-level depth.
I communicate clearly and align engineers, PMs, and stakeholders around shared goals.
I drive meaningful business impact by improving product velocity and reducing friction.